Hello again Premium Members. If it seems like longer than usual since the last time you have heard from me, that would be correct. You see, I was unfortunately spawned by humans just like all of you. And just like any other humans, my progenitors are prone to bodily affliction and eventual demise. Not to worry though, as demise seems to have been avoided. I also saw the new movie Oppenheimer, and I must say, they made my day job look way more exciting than it is, although I suppose during those days it was. Nowadays, we nuclear physicists are mostly veterans of a war that was never fought, or preparing to fight a future war that hopefully never comes. The movie did however inspire me to loudly blare intense orchestral music in the background while I work, and that lasted all of about 5 minutes before I realized, I don’t like classical music, and I don’t know anyone who does. You may have also noticed some new content on my page in the form of ensemble results of neural networks trained on different sets of fight data to determine variance as a result of either over-training or randomness in the testing data. So let’s talk science!
The topic of this weeks article is variance. Variance measures how different samples in a population are from each other. For instance, if you measured the reach of all Bantamweights in the UFC, the average would probably be around 67 inches. The standard deviation, which is the square root of the variance, would probably be around 2 inches. If the reaches were normally distributed, this would mean 95% of all Bantamweight reaches would be within 2 standard deviations of the mean, or in this case between 63 inches and 71 inches. These are estimates off the top of my head, so don’t fact check them. They are meant to be nice round numbers to help define variance and standard deviation. What about something with a very small variance, like the weight of all Bantamweights on weigh-in day. Well, in this case, most of those measurements would be 135 pounds. There would be the occasional weight miss, but 90%+ of the measurements would be right at the weight limit. Thus, the average would be slightly above 135 pounds, and the variance would be quite small.
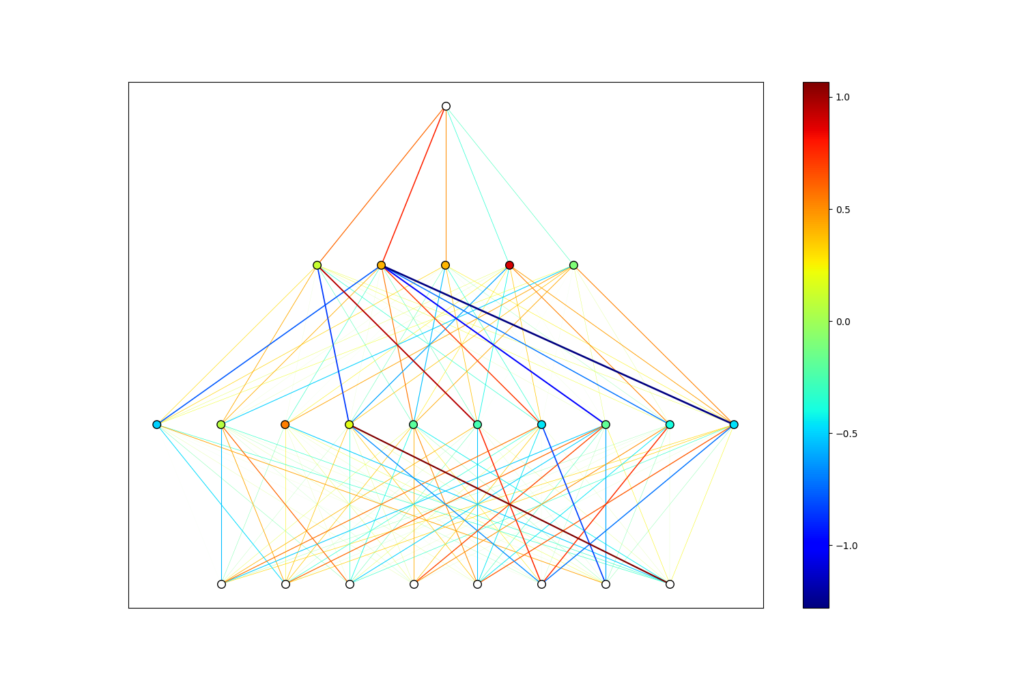
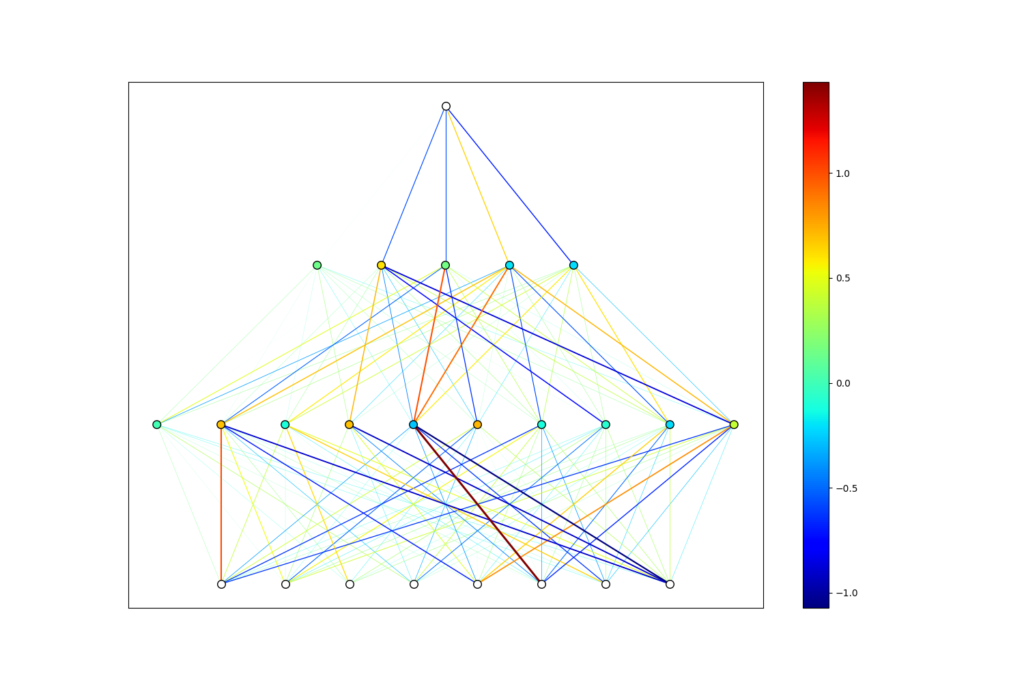
Why am I writing about this? Well, it turns out that for neural networks predicting outcomes of a process with some randomness, it is important. I have mentioned previously that 100% accuracy is not possible when predicting the outcome of a process with some inherent randomness like professional face punching, but there is a more serious consequence of this than the accuracy cap. It turns out that when the thing you are trying to predict is not completely determined by numbers, two different neural networks trained on the exact same data can make quite different predictions on unseen test data. This is because the weights and biases of a neural network are initiated randomly. They have a random starting point in phase space, and hence take different paths to optimize the loss function. Because of this, they may hone in on different patterns in the training data, and hence end up with differently trained weights and biases. Below you will see two networks trained to a point where they predict 65% of historical data correctly based solely on biometric data. They are clearly very different, but equally accurate. Variance occurs when these networks give significantly different predictions on future events, leading us to choose which one to trust.
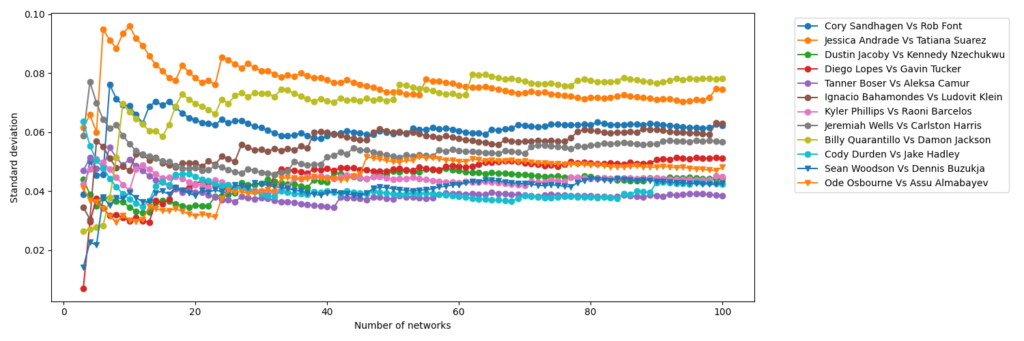
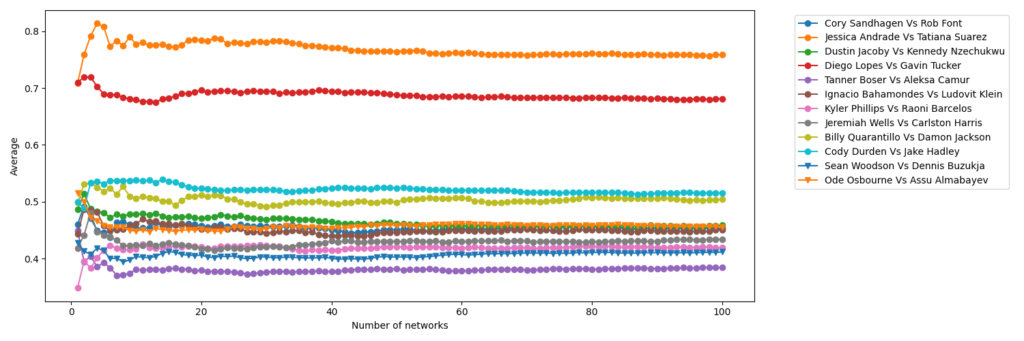
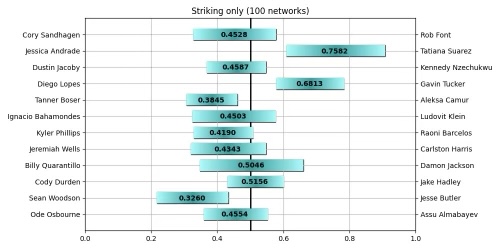
The good news is, we don’t need to choose a single network. We can take an ensemble average of hundreds of networks, and measure the mean and variance of their predictions. These are the figures that have been added to my page. They show the mean prediction out of 100 networks, with a bar spanning two standard deviations in both directions. This means 95% of the predictions lie somewhere in this bar. One might ask if 100 networks is enough, and this can be decided by measuring the mean and standard deviation after adding each network to the ensemble. Once these numbers converge to a constant value, the mean and standard deviation have converged, and adding more networks to the ensemble will cease to change the prediction of the ensemble. This can be seen below for the 100 networks trained on biometric only.
So how should you interpret these figures? Well, imagine that each network is a student in a class. Further imagine that they are all equally smart, and get the same scores on standardized tests. They are different however in that they each are smarter in some areas than others. Thus two students could get 10 questions wrong out of 50, but they are 10 completely different questions. All we know is that they both got an 80%, which by American standards is quite good. Next we ask all 100 students the same question, and measure the average and standard deviation of their responses. In our case, we ask 100 networks who will win a fight and with what percent confidence. Because I have trained on subsets of the data, namely biometric, striking, and grappling separately, this would be the equivalent of different classes on different subjects. So if all 100 students in a class agree who wins a given fight, but with different confidence levels, this would be represented as a bar lying entirely on one side of the plot without crossing the midway point. If the bar spans the midway line equally on both sides, this means half the students picked one fighter, and the other half picked the other fighter. While this does not inspire much confidence, it should tell you that based on the type of data, the fight would be too close to call. This could happen for instance if two fighters of similar age and exactly the same reach and height were fighting against each other. In this case, we wouldn’t expect a network trained on biometric data only to be able to make a decision.
The content added to the page is a mere experiment to help understand the inner workings of PickGPT, but once I am able to reduce the variance and increase the accuracy for each group of related metrics, these networks can be used as a pertained layer which feed into a larger network. The results could even simply be weighted based on how we see a fight playing out. For instance, if a fight is likely to be a striking match, one might simply consult the striking and biometric networks, and if one of them isn’t able to make a definitive decision, the other is likely the most informed prediction. Basically, we can get frustrated by the stochastic nature of the sport, or we can embrace variance and use it to inform our decision making process, while acknowledging that less of it would be preferable.